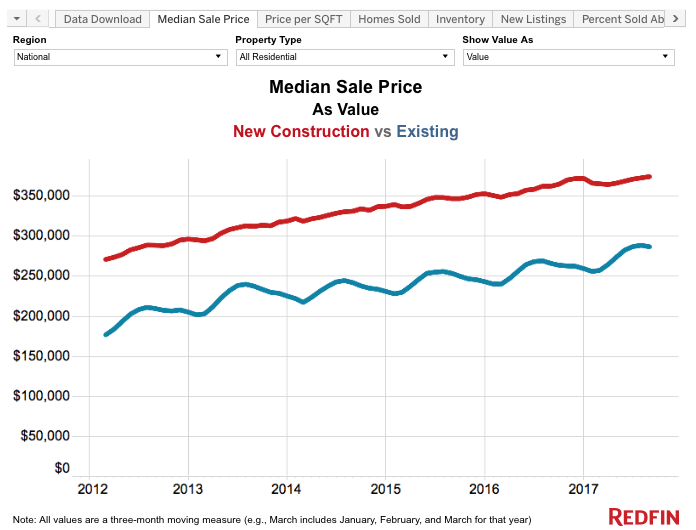
The average price of a new construction home that sold from July through September was $374,000, according to a new quarterly analysis on the new construction market released Wednesday by Redfin.
Redfin found new construction homes sold at an average premium of $87,000 in the third quarter compared to existing homes. New home prices were up 3.3% year-over-year compared to existing home prices, which grew by 7.9% in September.
In conjunction with the release of its inaugural quarterly report on new residential construction, Redfin is making monthly data on new home prices, sales and inventory, as well as building permit data from the U.S. Census, available on its Data Center. The downloadable datasets are available at the national, metro and county levels, going back to 2012, and will enable consumers, researchers and the media to study the new construction market, analyze average construction costs and compare the number of units built per capita across regions. Redfin will update the Data Center and report on new construction trends on a quarterly basis.
The Redfin analysis found new homes represent a growing share of the market over the past five years—rising from one in 13 homes for sale in September 2012 to one in eight homes in September 2017. However, housing starts—the number of new residential homes that have begun construction—are still 22% below their long-term average.
Single-family building permits, which offer a look at the new home pipeline, were up 9.7% year-to-date through September compared to last year. More than three-quarters of the nearly 100 metro areas Redfin tracks had positive growth in the first eight months of the year in single-family permits compared to last year. New permits for multi-family units (buildings of five or more units, including both apartment and condo developments) were down 3.6% year to date.
“After almost a decade of underproduction, we are finally seeing a slow, steady increase in single-family housing starts, up 9% from a year ago,” said Redfin chief economist Nela Richardson. “But high building costs are limiting the construction of homes that today’s buyers can afford. This is why even in the midst of extreme inventory shortages for existing homes, new homes are sitting on the market instead of selling.”
The national average cost to a builder constructing a new home—which includes the estimated cost of labor plus materials—was $240,000 for single-family units in August this year, which is the highest since the Census began reporting this in 1988.
Construction costs are rising in part because the availability of construction workers is still 25% below the peak in 2006 and there is also less competition among home builders. Housing material costs have also been rising, with lumber prices recently hitting their highest level on record since January 2003.
“We would love to build more affordable starter homes, but when high-end homes cost the same to build and are far more profitable, we lose the incentive to build smaller units,” said Isaac Stocks of Azure Northwest Homes, a Seattle-area home builder.
Metro-level highlights for new construction in the third quarter:
- Nashville, TN had the highest portion of new home sales over the last three months, with 24% of all homes sold being new construction. Raleigh, NC and Austin, TX each followed closely behind at 23.2% and 18.9%, respectively.
- The four metro areas with the lowest shares of new construction sales were all in New York and New Jersey led by Buffalo, NY at just 0.8% of home sales followed by Camden, NJ (1.5%), Hudson Valley, NY (1.6%) and Rochester, NY (1.6%). Six of the following seven lowest-ranked metro areas were in California—each with under one in 40 home sales being new construction.
- The metro areas with the highest year-over-year price growth per square foot for new construction sales last quarter were Birmingham, AL (21.9%), Hudson Valley, NY (21.0%) and Long Island, NY (17.4%). The California Bay Area metros of San Francisco and San Jose each posted negative price growth per square foot for new construction homes—falling 6.2% and 4.2% year-over-year.
- The estimated cost of constructing a new unit during the months of June, July and August this year was the highest in Long Island, NY at an average of $451,000 per home. Honolulu, HI ($451,000), Tucson, AZ ($272,000), and San Francisco ($269,000) rounded out the top four for average cost per unit permitted.
- Austin, TX, Raleigh, NC and Nashville, TN are building the most homes per capita at 29, 28 and 27 units per 10,000 residents, respectively. In contrast, Allentown, PA and Long Island, NY had far fewer new homes in the pipeline at only 0.5 and 1.1 units permitted per ten thousand residents respectively.
- A look at the total volume of building permits reveals that the metro areas poised to build the most new homes in the coming months are Houston, TX (10,000), Dallas, TX (9,400), Phoenix, AZ (7,800), and Atlanta, GA (7,700).
- Those with the largest year-over-year increase in units permitted include Oakland, CA (142%), Riverside-San Bernardino, CA (96.7%) and Tacoma, WA (76.9%).