Meyers Research New Home Pending Sales Index (PSI) for November 2019, released Friday, shows pending sales increased both year-over-year and month-over-month across the United States.
The index is a leading residential real estate indicator based on the number of new home sales contracts signed across the country.
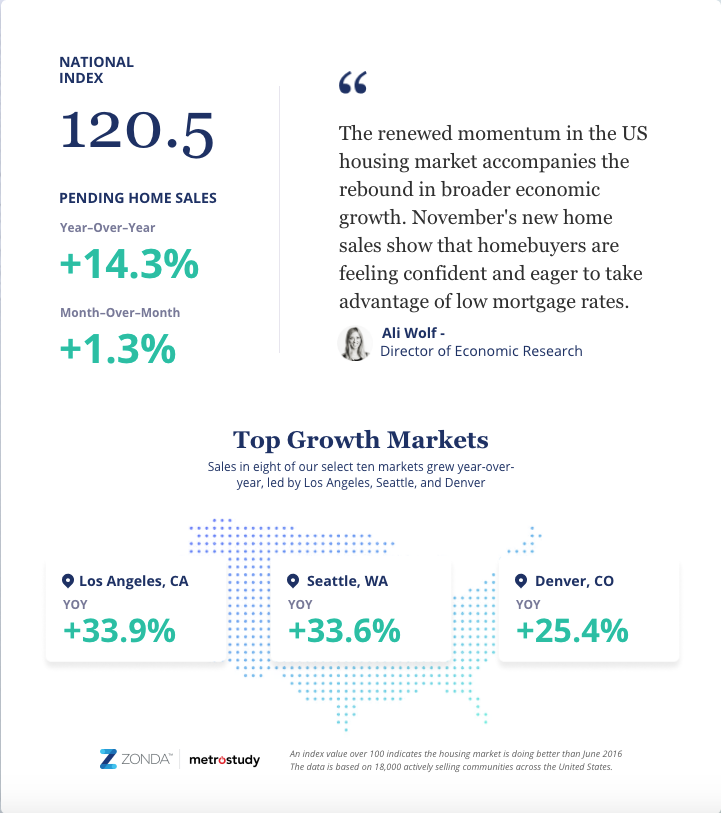
The New Home PSI came in at 120.5 for November, representing a 14.3% increase from November 2018. On a month-over-month basis, new home sales increased by 1.3% between October and November 2019.
“The renewed momentum in the U.S. housing market accompanies the rebound in broader economic growth,” said Ali Wolf, director of economic research at Meyers Research. “November’s new home sales show that home buyers are feeling confidence and are eager to take advantage of low mortgage rates.”
Eight of the ten key markets grew year-over-year and seven of the ten increased month-over- month. Los Angeles, Seattle, and Denver experienced the most significant growth compared to last year, up 33.9%, 33.6%, and 25.4%, respectively.
The national index is 5.0% higher than November 2017. Phoenix and Dallas show double-digit increases on a two-year basis, highlighting the strength of the local housing markets. November home sales also show momentum in Houston, Denver, and Washington, DC on a two-year basis.
New-home sales in Los Angeles are 20% below the market’s May 2017 peak. Pending new home sales in San Francisco, another top California market, hit peak in March 2017; current levels are 27% below that. The drop in new home sales can be attributed to a handful of factors, including limited supply, high prices, and the tax reform bill signed in 2017. Homes that meet buyer demand whether through design, price, location, or school district are still selling well in these markets, though.
Said Wolf, “Homeownership remains an important part of the American Dream. In today’s limited inventory and high price environment, consumers are increasingly willing to make some compromises to turn that dream into reality.”
New-home data is susceptible to outsized swings in contract activity based on shifts in the number of actively selling communities. As a result, Meyers Research normalizes the data to ensure consistency across the index. The New Home PSI blends the cumulative sales of active or recently sold-out projects with the average sales rate per community, which adjusts for fluctuations in supply. The New Home PSI is seasonally adjusted based on each markets’ specific seasonality and removes outliers. The index is base-lined to 100 for June 2016. Today’s national New Home PSI is 20.5% above the base level.
The next Meyers Research New Home PSI press release, featuring December 2019 data, will be issued on Thursday, January 23, 2020 at 9:00 a.m. ET. Meyers Research is a corporate sibling of BUILDER.


